Hans Lugtigheid
Samenvatting:
Abstract
With excess mortality in a year people died who were expected to die in a later year. With the pandemic this effect happens in multiple years. Pandemic Adjusted Excess Mortality (PAEM) lowers expected mortality in a year with the estimated number of people who have died in an earlier year than expected. Actual minus expected mortality gives excess mortality.
The Dutch Central Bureau of Statistics (CBS) adjusts every year the expected mortality based on population size at the 1st of January. The CBS claims this includes the effect from PAEM. The CBS also changed the way of estimating expected mortality as of 2024.
Compared with PAEM the numbers from the CBS for the years 2020-2030 underestimate excess mortality strongly. This article shows how PAEM works and analyses the differences.

1- Introduction
Note: The numbers in this article are for the Netherlands. For you own country use the appropriate numbers.
December 28. Connie looks at the coffin with her grandmother. ‘Terrible that covid’, she thinks, ‘without it granny would have made it easily to the summer. And she loved spring so much.’ Her inner statistician muses on: ‘Without covid she would have died next year. Hmm, then we have to lower the expected mortality for next year with one.’ Connie startles herself. ‘Come on girl. This is not the time for statistics.’ she tells herself.
Indeed, a funeral is not a good moment for statistics. Connie makes a valid point though. The method PAEM will show that.
The pandemic has drawn attention to excess mortality and the way it is calculated. There is also a lot of discussion on the reason of excess mortality. Then it is important to have a good insight in the size of excess mortality. Without this insight there is the risk that wrong numbers are used as a base for research. This can lead to faulty conclusions.
Excess mortality in a year is calculated as actual mortality minus expected mortality. Actual mortality is measured at the end of the year. Hence excess mortality is directly dependent on the way expected mortality is determined.
The expected mortality for the years 2020-2030 in the Prognosis 2019-2060 (P-19) by the Dutch Central Bureau of Statistics (CBS) from December 2019 is the base for the calculations. This prognosis is pre-pandemic.
This article considers three methods to determine expected mortality and, from that, excess mortality with the pandemic.
- P-19 – This method compares the expected mortality from P-19 with actual mortality.
- CBS – At the beginning of each year the CBS adjusts the expected mortality. The CBS bases this adjustment on the population at the 1st of January of that year.
- PAEM – Pandemic Adjusted Excess Mortality. This method assumes that covid is the only disturbing factor. When in a year there is excess mortality, say by a flu wave, then there are people who die from the flu who would have died in a later year without the flu wave. Hence in the years to come just as many people less than expected shall die to compensate for those who died in an earlier year. With the pandemic this effect for excess mortality happens in more years. PAEM lowers the expected mortality in a year with the estimated number of people who have died in an earlier year than expected. Then PAEM compares actual mortality with the newly determined expected mortality.
The CBS claims that the described effect from PAEM is included in their annual adjustments. However, expected mortality according to PAEM is significant lower than according to the CBS and excess mortality according to PAEM is significant higher than according to the CBS. This difference must be caused by a second disturbing factor. This article investigates this difference.
Part 2 contains for every method the expected mortality and excess mortality for the years 2020-2023 and an analysis of the differences. These years are in the past and the numbers are known.
Part 3 contains three effect regarding excess mortality:
- Excess mortality (with-)in a year: For example people who died in April 2020 from the pandemic but would have died in Oktober that same year without the pandemic. This can be from covid as well as other causes than covid.
- Excess mortality split in mortality from covid and mortality from non-covid causes.
- Compensation: After a period of excess mortality there should be a lower mortality in a later period by the same amount to compensate for theearlier excess mortality.
The CBS has changed the way to determine expected mortality per 2024. Part 4 contains the change of expected mortality as of 2024 by the CBS for the years 2024-2030 and an analysis of the result.
Part 5 contains for every method the expected mortality and excess mortality for the years 2020-2030 and an analysis of the differences.
In part 6 we discuss the results in this article.
2 – Expected and excess mortality 2020-2023
Three methods to determine expected and excess mortality.
- Method P-19
- Method CBS
- Method PAEM
Method P-19
Method P-19 compares expected mortality from the Prognosis 2019-2060 (P-19) by the CBS from December 2019 with actual mortality. See table 1.
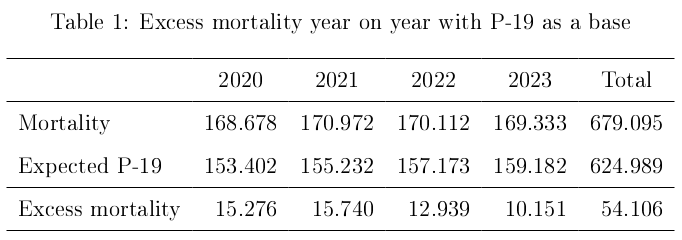
Total mortality for the years 2020-2023 according to P-19 equals 54.106.
Method CBS
Each year in December the CBS makes a prognosis with, among others things, the expected mortality for the years to come. This prognosis for the next year replaces earlier prognoses. According to the CBS: ‘The prognoses take into consideration the fact that the population always changes: immigrant enter (who are relative young), we are graying and we are getting older. (CBS, 2022a \cite{CBS 2022a}).’
The CBS adjusts in the prognosis 2020-2070 from December 2020 the expected mortality for 2021 from P-19, 155.232, tot 154.887. A difference of 345. The CBS adjusts in the prognosis 2021-2070 from December 2021 the expected mortality for 2022 from P-19, 157.173, to 155.493. A difference of 1.680. The CBS adjusts in the prognosis 2022-2070 from December 2022 the expected mortality for 2023 from P-19, 159.182, to 156.666. A difference of 2.516. For the prognoses see CBS 2024a \cite{CBS 2024a} The adjusted expected mortality by the CBS and the resulting excess mortality are in table 2.

The total excess mortality for the period 2020-2023 according to the CBS equals 58.647.
Method PAEM – Pandemic Adjusted Excess Mortality
The method PAEM presumes that the pandemic is the only disturbing factor and corrects the expected mortality for people who died earlier than expected according to P-19. PAEM calculates excess mortality as actual mortality minus this corrected expected mortality. Because the pandemic is the only disturbing factor other deviations are negligible.
The method PAEM uses estimates. With expected mortality these come from the question in which years people who count as excess mortelity would have died without the pandemic. The estimate then is a distribution of the group that died in a certain year over later years in which those people would have died without the pandemic. Basic assumption for the estimates is that the pandemic affects older people more than others. The total excess mortality for the year under consideration is constant. Hence with a difference of opinion for the estimate for a certain year the whole estimated distribution must be reviewed. The estimates are first estimates. When better estimates are available these can lead to adjustments. So some caution with the results is called for.
An example. In 2020 (rounded) 21.000 people died from covid. In which year would these people have died without the pandemic? Table 3 gives four scenario’s.
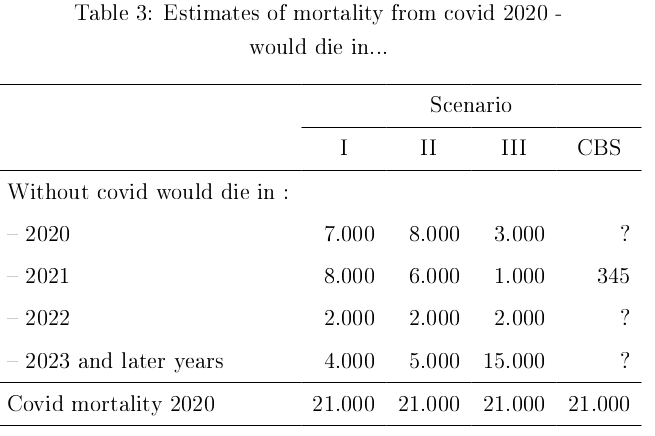
The total always adds up to 21.000. The 7.000 from 2020 are people who without the pandemic also would have died in 2020. For example people who died in April from covid but would have died in October without the pandemic.
If the estimate of 8.000 for 2021 from scenario I is deemed too high then this estimate might for example be decreased with 2.000 to 6.000. Because the total add up to 21.000 the numbers in other years have to increase with in total 2.000. There is a waterbed effect.
In 2020 many people died from covid who were at an older age. This makes scenario’s I and II more likely than scenario III. In this article scenario I is presumed. The reasoning and method stay the same with other choices than this scenario. If scenario II is presumed then the estimate for 2021 is 6.000. This is still a significant number. And, because of the waterbed effect, an increase of excess mortality with 2.000 in other years.
The CBS adjusts the estimate from P-19 with 345. See table 3, scenario CBS. If the pandemic is the only disturbing factor then the CBS has to distribute more than 20.000 over the other years. This makes the adjustment of 345 by the CBS with the pandemic as only disturbing factor not realistic.
Method P-19 gives 15.276 people more than expected died in 2020. It is estimated that from these 8.000 people would have died in 2021 without the pandemic (table 3, scenario I). The expected mortality for 2021 decreases from 155.232 from P-19 with 8.000 to 147.232. Excess mortality increases with 8.000 to 23.740. For the year 2022 expected mortality is adjusted from 157.173 from P-19 with 9.000 to 148.173 and for 2023 expected mortality is adjusted from 159.182 from P-19 with 11.500 people to 147.682. These 9.000 and 11.500 people died in years earlier than expected according to P-19 and would have died in 2022 respectively 2023 without the pandemic. See appendix A for a calculation of these numbers. The result is in table 4.

Total excess mortality for the years 2020-2023 according to PAEM equals 82.606.
Difference CBS and PAEM
The CBS calculates the expected mortality per age-group and determines total expected mortality by adding those numbers per age-group. PAEM calculates expected mortality directly for the total population. Those outcomes should be the same. Hence PAEM is control for the total expected and excess mortality calculated by the CBS.
In December 2020 the CBS adjusted the expected mortality for 2021 with 345. The method PAEM adjusts the expected mortality with 8.000. The difference is 7.655. For 2022 CBS 1.680 and PAEM 9.000, a difference of 7.320. For 2023 CBS 2.516 and PAEM 11.500, a difference of 8.984. The difference between excess mortality according to CBS and according to PAEM is in table 5.

The total difference in excess mortality for the years 2020-2023 between the method CBS and the method PAEM is 23.959.
The difference in 2021 is 7.655. With PAEM the adjustment from P-19 is 8.000. According to the CBS the effect from PAEM is included in the estimate by the CBS. Hence in the estimate by the CBS there must be a second disturbing factor that decreases the estimate from the CBS from 8.000 to 345. See table 6.
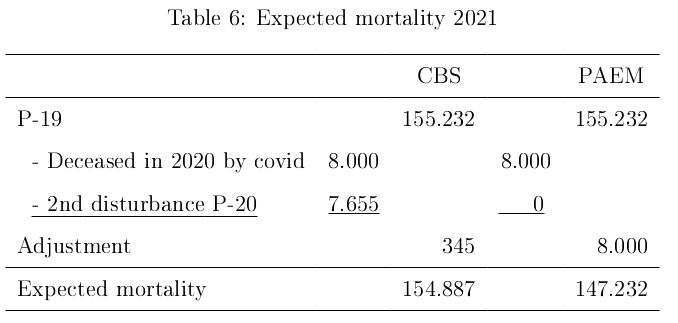
With determining the expected mortality as of January 1st of a year the CBS bases its estimate on the population as of January 1st of that year. According to the CBS everything from the past is included in their estimate and the differences are mainly due to immigration and changed population. This is to general. According to the CBS the estimate of 8.000 for 2021, or at least the underlying effect, is included in their new adjustment of the estimate by 345 for 2021. This gives a difference of 7.655 between the two estimates. If this is explained by, for example, immigration then the question is what the CBS sees as the cause for the extra mortality. Say the extra immigration is 20.000, then which 7.665, or part thereof, of these will die in the same year of immigration? Are all immigrants older than 87 so that a third of them will die within the year? Or does the CBS expects the new young immigrant to die from a new disease in the Netherlands from which they have no resistance? Etcetera. It is not enough to say that the higher than expected mortality is explained by higher immigration and changes in population. A further explanation for the increase in the expected mortality as the CBS calculates is needed.
It can also be that the usual method to determine expected mortality that was adequate in non-pandemic times is not adequate in times of a pandemic. Some new factors caused by the pandemic can play a role in this. For example the mortality from covid can lead to a changed distribution of people with a certain life expectancy in age-groups. Then the usual used percentages to calculate expected mortality in those age-groups can lead to incorrect results. For more on this see Lugtigheid, 2023b.
It is up to the CBS to explain the difference in the estimate by the CBS and to provide a 2nd disturbance.
3 – Three effects regarding excess mortality
Three effects regarding excess mortality.
- Premature mortality – excess mortality in the year
- Compensation of excess mortality in later years
- Excess mortality from covid and from other causes than covid
1 – Premature mortality – excess mortality in the year
Besides year on year excess mortality there is also excess mortality in the year. For example people who died in April from covid and would have died in October without the pandemic. Or people who have died earlier from other causes than covid, like psychic causes or delayed medical treatment etc. This non-covid early mortality is difficult to estimate. To account for the effect this is estimated at 1.000 per year. Those do not count as excess mortality in the usual reported excess mortality. This premature mortality is excess mortality within or in the year.
The article ‘Excess mortality is strongly underestimated’ (Lugtigheid, 2023a \cite{Lugtigheid 2023a}) estimates this effect for 2020 at 8.000 (7.000 from covid, see also table 3, and 1.000 from non-covid) , for 2021 at 6.000 (5.000 covid and 1.000 non-covid) and for 2022 at 3.000 (2.000 covid and 1.000 non-covid). This article uses these estimates. For 2023 assume 2.000 (1.000 covid en 1.000 non-covid). The total for the years 2020-2023 is 19.000.
The total premature or excess mortality for these years according to PAEM then comes at 82.606 + 19.000 = 101.606. See table 7.

This is 42.959 more than the excess mortality according to the CBS. See table 8.

Observe that the CBS doesn’t count the excess mortality in the year. If the CBS would do this the difference would be smaller.
2 – Compensation of excess mortality in later years
When in a year there is excess mortality, for example due to a flu wave, then people die who would otherwise have died in later years. In later years there will be a mortality deficit by the same amount. With a pandemic this effect plays over more than one year.
In table 1 excess mortality is mortality that is higher than expected mortality from P-19. In the years 2020-2023 this gives an excess mortality of 54.106. Then it is to be expected that in the years 2024 and later 54.106 less then expected according to P-19 will die. This calculation does not adjust the expected mortality with the prognoses by the CBS in December every year. This is the base for compensation.
In table 3 the excess mortality according to PAEM equals 82.606. Then one might think that in 2024 and later years 82.606 less then expected will die. That is 28.500 more than in table 1. Yet not more people have died. This seems to be a contradiction.
The explanation is as follows. For 2021 PAEM adjusts the expected mortality with 8.000 who would have died from the pandemic in 2020. Then these 8.000 are compensated for in 2021 and don’t need to be compensated for in 2024 and later. The same applies for 9.000 people in 2022 and 11.500 in 2023. Out of the 82.606 excess mortality in the years 2020-2023 already 8.000 + 9.000 + 11.500 = 28.500 are compensated for in the years 2020-2023. Then 82.606 – 28.500 = 54.106 remain to be compensated in the years 2024 and later. The CBS adjusts P-19 for 2021 with 345, for 2022 with 1.680 and for 2023 with 8.984. In total 345 + 1.680 + 2.516 = 4.541 is already compensated by the CBS. Then 58.647 – 4.541 = 54.106 remain to be compensated in the years 2024 and later. See table 9.

It is important to be careful with conclusions on mortality numbers to compensate. It matters whether the expected mortality prior to the pandemic, like P-19, is adjusted afterward.
3 – Excess mortality from covid and from other causes
In 2021 according to the CBS 19.000 people (rounded) died from covid. In the article ‘Excess mortality is strongly underestimated’ (Lugtigheid, 2023a excess mortality from covid in 2021 is estimated at 14.000 and mortality from covid in the year is estimated at 5.000. This estimate is done in the same manner as for the mortality from covid of 21.000 from 2020 in table 3. According to the CBS total excess mortality in 2021 equals 16.085. Then excess mortality from other causes than covid or non-covid excess mortality equals 16.085 – 14.000 = 2.085. According to PAEM excess mortality in 2021 is 23.740. Then the non-covid excess mortality equals 23.740 – 14.000 = 9.740. For 2020 and 2022 the numbers are calculated in the same way. For 2023 the CBS gives excess mortality of 12.667 and a mortality from covid of rounded 5.000. See table 10 for an overview.

The mortality from non-covid by the method PAEM is significant higher than by the method CBS. For example in 2021 according to the CBS 2.085 more than expected people died from non-covid causes and according to PAEM 9.740. This difference is significant. Whit the evaluation of the pandemic and the used policies the extra mortality by the CBS is relatively small. According to PAEM this is significantly higher with almost 10.000. Then more mortality from non-covid causes has to be researched and explained.
For the period 2020-2023 the total difference in non-covid excess mortality between PAEM and CBS equals 43.606 – 19.647 = 23.959.
CBS adjustment expected mortality 2024-2030
4 – CBS adjustment expected mortality 2024-2030
As of the year 2024 the CBS has changed back to its regular statistics on mortality (CBS 2024b).
The CBS returns to the way in which it determined the mortality numbers, expected mortality and excess mortality before the pandemic. De mortality monitor from the RIVM (Official Dutch Health Organization) will, just as before the pandemic, be the main source for for measuring and monitoring possible excess mortality per week in the Netherlands.
The following is of interest. With the pandemic the CBS always excluded expected mortality from covid for the estimate of expected mortality next year. The reason was to be able to compare mortality with pre-pandemic expected values. In the prognosis 2023-2070 from December 2023 (P-23) the CBS has decided as per January 1st of 2024 not to exclude expected mortality from covid in the estimates for mortality in the next year. With this change in determining expected mortality the expected mortality in the years 2024-2030 according to P-23 increases compared to P-19.
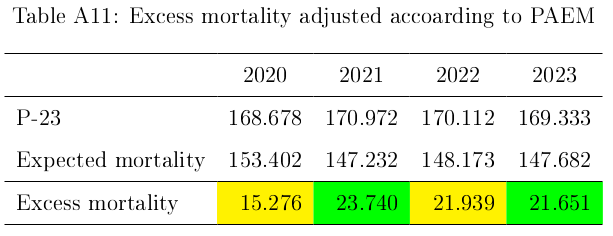
The expected mortality for the years 2024-2030 from the CBS deviates significantly from the estimates of P-19. With mortality in the years 2024-2030 as the CBS expects there is a huge excess mortality of 28.613 compared to P-19. The CBS does not give an extra explanation besides the pandemic. Hence the adjustment by the CBS is due to the pandemic. See table 11.

With the method from the CBS the excess mortality equals (of course) 0 when these estimates are right. See table 12.

In the prognosis of December 2019 the CBS had estimates for the years 2020-2030. In the prognoses made in the years 2012, 2013…2018 the CBS also had estimates for the years 2020-2030. These estimates were fairly consistent throughout the years. Also the prognosis of December 2022 (P-22) has estimates for the period 2024-2030 which are close to those of P-19. See CBS StatLine-a. Recall that these were without the expected mortality from covid in the estimated years. The changed estimates by the CBS of the expected mortality for the years 2024-2030 are significantly higher than those from P-19 and P-22. Then the CBS has to explain what causes this adjustment. Just citing immigration and/or changed population as the CBS does is not specific enough. Which immigration leads to which extra mortality? If the pandemic has ended then the estimates for the expected mortality should be back to the level of P-19. Or even lower because of compensation for excess mortality as discussed earlier. With no other specific cause for the increased expected mortality the difference is explained by the pandemic. That is possible. But then we are not back to the normal from before the pandemic. The new estimates lose part of their informational value. Especially with respect to the mortal damage the pandemic has caused.
5 – Expected and excess mortality 2020-2030
To establish expected mortality and excess mortality it is assumed that actual mortality for the years 2024-2030 equals the new expected mortality by the CBS from P-23. The numbers for 2020-2023 are equal to those from part 2.
Three methods to determine expected and excess mortality.
- Method P-19
- Method CBS
- Method PAEM
1 – Method P-19
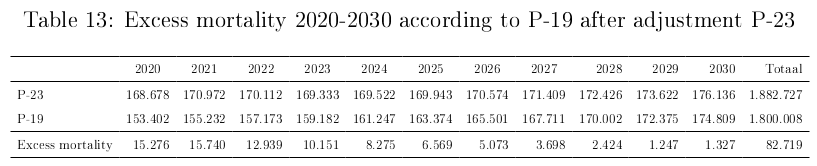
The base P-19 gives total excess mortality of 82.719. See table 13.
2 – Method CBS
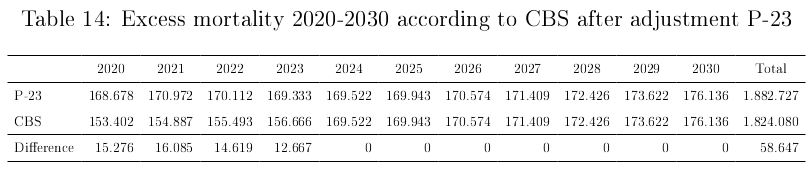
The method CBS gives a total excess mortality 58.647. This is the reported excess mortality by the CBS in the years 2020-2023. For the years 2024-2030 excess mortality equals 0. See table 14.
3 – Method PAEM
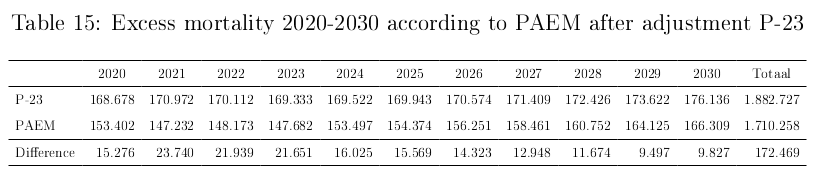
The method PAEM gives a total excess mortality of 172.469. For the calculations see appendix B. See table 15.
In part 2 the premature mortality or excess mortality in the year was calculated at 19.000. Say for this article excess mortality in the year for 2024-2030 is 1.000 per year. Then total excess mortality in the year equals 26.000 for this period. Total excess mortality according to PAEM comes at 172.469 + 26.000 = 198.469.
Difference PAEM – CBS
The difference of excess mortality according to the method PAEM and the method CBS equals 113.822. See table 16.

With excess mortality in the year of 26.000 the difference between PAEM end CBS equals 113.822 + 26.000 = 139.822
Compensation excess mortality
For compensation of excess mortality the excess mortality for the period 2020-2030 ad 82.719 from P-19 is the basis. This 82.719 has to be compensated for all three methods as a mortality deficit in the years 2031 and beyond. The expected mortality by the CBS for the period 2020-2030 is with 58.647 lower than with P-19. Then the compensation according to P-19 must be lowered with the method CBS. See table 17.

6 – Discussion
The aim of this article is to give a signal that many used methods to determine expected and excess mortality with a pandemic give a flawed idea of the influence that the pandemic has on mortality and excess mortality. The numbers from the CBS are taken as an example. PAEM is a method to check total expected and excess mortality.
In this article I use estimates. Some of those estimates are, obviously, uncertain. The estimates can be improved upon. Even with doubts over some estimates the method PAEM is a useful instrument.
Table 18 gives an overview of the three methods from this article.
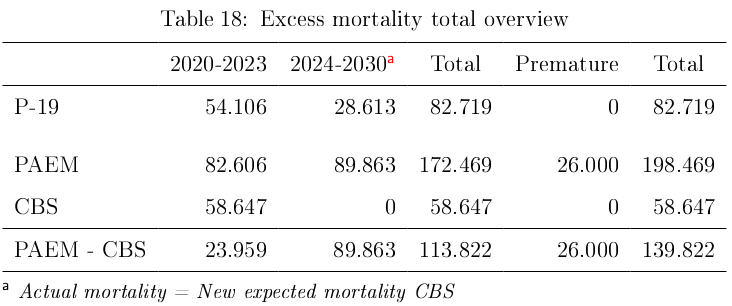
The difference between CBS and PAEM is significant. Both for the period 2020-2023 and for the period 2024-2030.
For the period 2020-2023 the main difference between CBS and PAEM is the adjustment of the expected mortality relative to P-19. The adjustment according to PAEM is an estimate with a reasonable bandwidth. The adjustment remains significant, also because of the described waterbed effect. The CBS explains the difference mainly with immigration and change in population. As shown in part 2 with the difference between the two methods the explanation by the CBS is not sufficient. With a clear reason for the difference this would have been noticed immediately. This gives cause to re-examine the way the CBS determines expected mortality with the pandemic. See also Lugtigheid, 2023b.
For the period 2024-2030 the new way of estimating expected mortality by the CBS has serious consequences. First because of the difference with PAEM with adjusting the expected mortality at the beginning of each year. Second because of the increase of expected mortality for 2024-2030 by the CBS relative to P-19.
There are different ways to estimate and determine the expected mortality and from that the excess mortality. Hence it is important to be clear and transparent about the used methods and the why of the used method. As of Januari 1st 2024 the CBS chooses to include the extra mortality from the pandemic in the estimates. Then the numbers from the CBS don’t show the excess mortality caused by the pandemic anymore. It is not clear why the CBS decided that the effects from the pandemic that are still in the numbers is not relevant anymore.
With the evaluation of the pandemic, its consequences, the implemented policies and the policies to come the results from PAEM have to be used. For a full account of the mortal damage from the pandemic the excess mortality in the year also must be taken into consideration.
As a consequence of excess mortality in a certain period the compensation must show in the mortality numbers in later periods. This translates into lower than expected numbers for mortality. The expected mortality with the CBS increases. In the years after 2030 the expected mortality by the CBS according to P-23 is in the range of the estimates from P-19. See StatLine-a. The delay of this compensation after 2030, in this article 82.719, is cause for concern and should be qualified as excess mortality.
The division in excess mortality between covid and non-covid mortality started with mostly covid. Now the focus changes to non-covid. It is important to monitor this in the years toe come. Much of this excess mortality is not yet clear, let alone explained.
Also note that these numbers are for the Netherlands. Many national statistics bureaus have a similar approach like the CBS. To give an idea what this can mean: ‘The EU has approximately 450 million inhabitants or 25 times the number in the Netherlands. Extrapolating the underestimated excess mortality in the Netherlands of, rounded, 100K, gives a 2.5 million excess mortality in the EU that is underestimated. In the EU live 6\% of the people on earth. So worldwide this gives 16 x 2.5 million = 40 million excess mortality that is underestimated.’
In summary:
- The way the CBS determines the adjustment of expected mortality per January 1st each year need to be reviewed.
- he consequences from the pandemic will last for a long time. It is important to monitor this effect the coming years. The new estimates from the CBS as of January 1st 2024 are not suited for this purpose. The method PAEM gives more insight and is useful as a control for the numbers from the CBS.
- The premature mortality in the year is significant and should be considered in analyses and evaluations.
- The compensation for excess mortality has to be monitored in the years to come. According to the prognoses from the CBS in 2024 this will not happen. That is reason for concern.
- As more statistics bureaus have a similar approach as the CBS the excess mortality that is not accounted for can run in the millions. It is important to study this also outside of the Netherlands.
References
Lugtigheid, H. (2023a). Excess mortality is strongly underestimated.
https://www.hanslugtigheid.nl/excess-mortality-is-strongly-underestimated
https://doi.org/10.5281/zenodo.8400639
Lugtigheid, H. (2023b). Expected mortality adjusted for distribution.
https://www.hanslugtigheid.nl/expected-mortality-adjusted-for-distribution
https://doi.org/10.5281/zenodo.8400609
CBS (2024a). Excess mortality and expected mortality.
https://www.cbs.nl/en-gb/news/2024/06/fewer-deaths-in-2023/excess-mortality-and-expected-mortality

CBS (2024b). CBS has changed back to its regular statistics on mortality.
https://www.cbs.nl/en-gb/news/2024/06/fewer-deaths-in-2023

CBS, (2022a). Sterfte en oversterfte in 2020 en 2021 – 3.3 Resultaten.
https://www.cbs.nl/nl-nl/longread/rapportages/2022/sterfte-en-oversterfte-in-2020-en-2021
CBS (StatLine). Observations and Prognosis 2012-2060 – Prognosis 2023-2070.
This table is not available in english on the CBS-website.
This table is not available as a webpage. To reproduce the table follow the steps below. Translation between parenthesis.
https://www.cbs.nl > Cijfers (Numbers) > Statline (Statistics Online) > Tabellen naar thema (Tables per theme) > Bevolking (Population) > Bevolkingsprognose (Population prognosis) > Kerncijfers van diverse bevolkingsprognoses en waarneming (Numbers various population prognoses and observation) >
- Onderwerp: Overledenen (Subject: Deceased) \
- Prognose/waarneming: Waarneming, 2012-2023 (Prognosis/observation: Observation, 2012-2023) \
- Perioden: 2012-2030 (Periods: 2012-2030)

Appendices
Appendix A. PAEM explained for 2020-2023
In this appendix the method PAEM is explained and elaborated on for the years 2020-2023.
We start with the year 2020. In P-19 the CBS calculated the expected mortal for 2020 at 153.402. Mortality in 2020 was 168.678. According to the CBS excess mortality equals 168.678 – 153.402 = 15.276.
The excess mortality concerns people who without the pandemic would have died in a later year. Then the expected mortality for the later years has to be decreased with the same number. Those people will not die in the later years. Table A1 gives a distribution of the excess mortality of people who died in 2020 over the years after 2020.
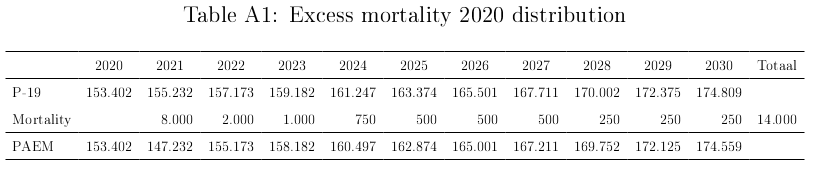
The numbers are a rough estimate. In total there are 14.000 people who died in 2020 and who without the pandemic would have died in one of the years 2021-2030. There are 1.276 people (15.276-14.000) people who would have lived until after 2030. See table A2.

The following calculations are for the years 2020-2023. See table A3.

In table A3 the adjustment for 2021 from mortality in earlier years comes to 8.000. The expected mortality for 2021 from P-19 equals 155.232. Subtract 8.000 from this number. Then the adjustment expected mortality for 2021 becomes 147.232. See table A4.

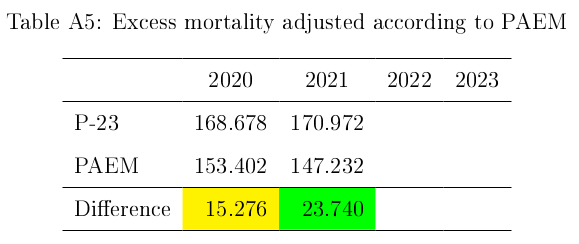
Mortality in 2021 was 170.972. With the adjusted expected mortality for 2021 of 147.232 excess mortality comes at 23.740. See tabel A5.
Just like excess mortality for 2020 divide the calculated excess mortality for 2021 of 23.740 over the years in which these people would have died without the pandemic. Table A6 shows the result.

According to table A6 the adjustment for 2022 for mortality in earlier years comes at 9.000. The expected mortality for 2022 from P-19 is 157.173. Subtract 9.000. This results in an adjusted mortality for 2022 of 148.173. See table A7

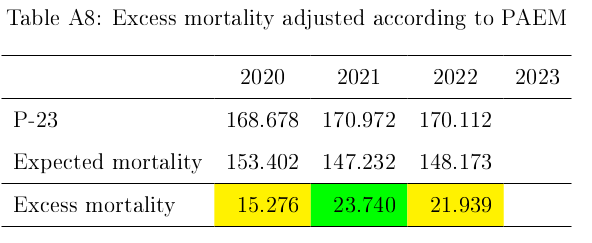
Mortality in 2022 is 170.112. With the adjusted mortality for 2022 of 148.173 the excess mortality for 2022 according to PAEM becomes 21.939. See table A8.
Just like excess mortality for 2020 we divide the calculated excess mortality for 2022 ad 21.939 over the years in which these people would have died without the pandemic. Table A9 shows the result.

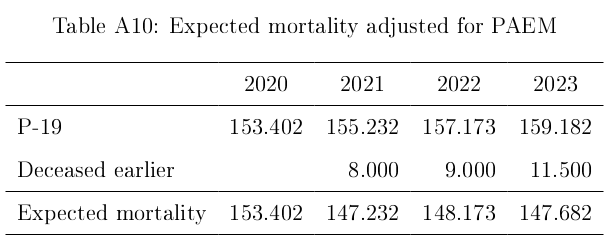
According to table A9 the adjustment for 2023 for mortality in earlier years comes at 11.500. The expected mortality for 2023 from P-19 is 159.182. Subtract 11.500. This results in an adjusted mortality for 2023 of 147.682. See table A10.
Mortality in 2023 equals 169.333. With the adjusted expected mortality for 2023 of 147.682 excess mortality for 2023 equals 21.651. See table A11.
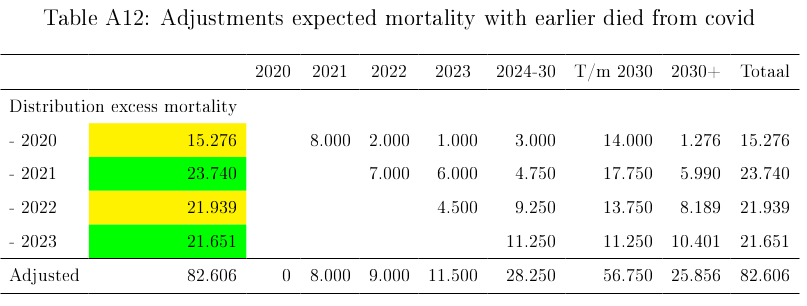
Just like excess mortality for 2020 and 2021 and 2022 divide the calculated excess mortality for 2022 ad 21.651 over the years in which these people would have died without the pandemic. Table A12 shows the result.
Etcetera for the following years.
Appendix B. PAEM adjustments 2020-2030
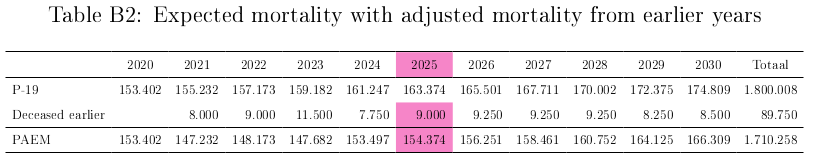
Table B1 contains the adjustments for all years according to PAEM. Tables B2 and B3 contain expected mortality respectively excess mortality for each year to be used in table B1 for the next year. The numbers for the years 2020-2023 come from appendix A. The calculations are according to the procedure PAEM in appendix A. An example:
- Table B1, column 2025: From the expected mortality for 2025 a total of 500 + 1.000 + 2.000 + 2.500 +3.000 = 9.000 people died in the years 2020-2024.
- Table B2, column 2025: Decrease the expected mortality for 2025 according to P-19, 163.374, with this 9.000 to 154.374. This is the expected mortality for 2025 according to PAEM at January 1st 2025.
- Table B3, column 2025: The actual mortality for 2025 (=expected mortality P-23) is 169.943. Decrease this number with the expected mortality according to PAEM, 154.374, to 15.569. This is the excess mortality for 2025.
- Table B1, row 2025: Estimate from the excess mortality for 2025 ad 15.569 in which years how many of these people would have died without the pandemic.
- Table B1, column 2026: Repeat the steps 1-4 for 2026 instead of 2025. Etcetera.