Amsterdam, November 2, 2023*
*Appendix A contained an error. I adjusted this in December 2025. The remainder of the article is unchanged.
Hans Lugtigheid
Abstract
This article analyses the conjecture that excess mortality is underestimated with the pandemic.
I use the numbers from the CBS (Dutch Central Bureau for Statistics) as an example. As a baseline we take the expected mortality for 2021 and 2022 from 2019. We correct this expected mortality with the estimated number of people who died in earlier years than expected because of the pandemic. For 2021 this correction is 8K. The CBS expects the mortality to be almost equal to the estimate from 2019. Then the excess mortality increases from 16K (CBS) to 24K.
I present the following idea to explain the difference. At the beginning of very year the numbers of people in year groups are usually adjusted by applying a historical determined percentage to the population at January first. Covid hits the weakest the hardest. This changes the distribution of the expected remaining life years in the year group. And thus the average expected remaining life years. Hence the percentage has to be adjusted. Then the expected mortality decreases and the excess mortality increases.
The excess mortality within a year are people who for example died in April from covid but who would have died in October without the pandemic. With this number total excess mortality rises with 6K to 30K.
Excess mortality is divided in covid and non-covid. De large increase in non-covid deaths is striking.
The analysis supports the conjecture that excess mortality is underestimated.
The excess mortality is strongly underestimated
Note: The numbers in this article are for the Netherlands. For you own country use the appropriate numbers.
Introduction
With the pandemic excess mortality has become a matter of interest. Much has been written, said and doubted about it. The main starting point is that there must be concurrence on the numbers. This article studies the determination of excess mortality and develops a method that functions as a logical check for the official numbers. The results are compared with the numbers of the CBS (Dutch Central Bureau for Statistics). However, the method is universally applicable.
In paragraph 2 some effects are discussed which affect the expected mortality.
Estimates play an important role in determining expected and excess mortality. In paragraph 3 the manner in which the estimates are obtained is discussed, along with the possibilities and limitations of the estimates. These estimates then are compared with the official estimates. A method to improve the official estimates is given and discussed.
In the paragraphs 4-7 are the consequences per year. These are numbers pertaining expected mortality, excess mortality, distinction between covid and non-covid, excess mortality within the year and total excess mortality. Those numbers are compared to those from the CBS.
In paragraph 8 the result are analyzed.
Paragraph 9 contains conclusions and recommendations.
Excess mortality and expected mortality
December 28. Connie looks at the coffin with her grandmother. ‘Terrible that covid’, she thinks, ‘without it granny would have made it easily to the summer. And she loved spring so much.’ Her inner statistician muses on: ‘Without covid she would have died next year. Hmm, then we have to lower the expected mortality for next year with one.’ Connie startles herself. ‘Come on girl. This is not the time for statistics.’ she tells herself.
Indeed, a funeral is not a good moment for statistics. Connie makes a valid point though. I will show that in this article.
The CBS defines excess mortality as a temporary, extraordinary rise of the number of deceased people that coincides with a particular event, such as a flu epidemic, heatwave or corona pandemic
(CBS, z.d. -a). The CBS calculates the expected mortality by looking at the mortality in the same period in the past without pandemic. The CBS calculates excess mortality per year as actual mortality minus expected mortality.
We begin with calculating the expected mortality.
Two additional effects are important when calculating the excess mortality.
1. Year on year:
Many older people who died in 2020 from covid would have died in 2021 without the pandemic. Their number can be estimated at January first of 2021. Hence we have to lower the expected mortality for 2021 by that number. And so on for subsequent years.
2. Year in year
A person dies from covid in, say, April. Without the pandemic that person would have died in, say, October. Then for the whole year this death does not count as excess mortality in the usual definition. This I call excess mortality within the year.
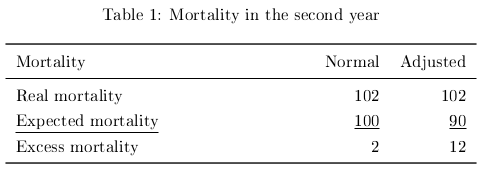
An example of the first effect. In a village 100 people die every year. In a year 10 extra people die from a heavy flu who would otherwise have died in he next year. Mortality is then 110. Thus the excess mortality is 10. Then in the following year 10 from an expected 100 have died a year earlier, Hence it is expected that in that year 90 people will die, 10 less than normal. Suppose that in the second year 102 people die. Then the excess mortality is 12, not 2. See table 1.
An example of the second effect. In the village 5 people die in April. Without the pandemic they would have died in October. Then in April 5 people more than expected die and in October 5 people less than expected die. The excess mortality for the whole year is 0. The excess mortality in the year is 5. See table 2.

With these two effect we can calculate excess mortality in a year. And we can break up excess mortality in covid and non-covid causes.
In this article I discuss the consequences of these two effects for the calculation of excess and premature mortality. We shall see that the excess mortality comes much higher than the CBS calculates.
On the used estimates
The first estimate is the following. According to the CBS 20.661, rounded to 21 thousand, people died from covid in 2020 (CBS, 2022). Without the pandemic a number of these 21 thousand also would have died in 2020, a number would have lived longer and have died in 2021, a number would have died in 2022 and so on. These numbers are unknown. So we have to estimate these numbers.
The estimates are indicative. For an estimate like 6.476 with a confidence interval of [6.476 – 234, 6.476 + 234] it is to early. Hence the estimates are rounded to thousands.
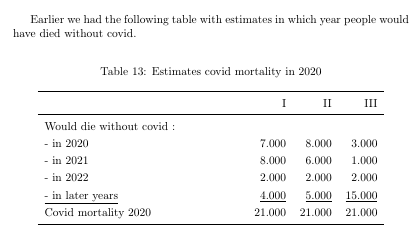
At first sight this might seem inaccurate. We can however deduce more than it seems. The totals have to add up to 21 thousand. Hence when we lower the estimate in one year, then we have to increase the estimate in another year (or years). In appendix A I give an example of this waterbed effect over two years. We notice that the combined excess mortality from the two years remains equal. The change in the estimate in one year is compensated in the other year. So, suppose an estimate for a specific year is questioned. Then one has to give an estimate for all the years with the same total combined. In table 3 there are three estimates for 2020.

The first two estimates reflect the fact that in 2020 many elderly people died from covid. Many of them would not have lived much longer without covid. Hence, these estimates seem likely. The third is unlikely because is not realistic that so many elderly people who died in 2020 from covid would have lived until 2023 or later.
For this article I have taken scenario I. I estimate that of these 21 thousand without the pandemic seven thousand would have died later in 2020, eight thousand would have died in 2021, two thousand in 2022 and four thousand would have died in a year later than 2022. This a fairly realistic estimate which is sufficient for the purpose of this article. Note that the estimates are rough. So the choice for estimate I is not forcing. With estimate II or another the method remains the same.
As baseline for the expected mortality I use the ‘Kernprognose 2019-2060’ from the CBS (CBS, 2019). This is a prognosis by the CBS from 2019 which is pre-covid. In the ‘Kernprognose 2019-2060’ expected mortality for 2021 is estimated to be 155.232. Normally the CBS adjusts this estimate in 2020. Without any further major disturbance this kind of adjustments are marginal. I presume the estimates from ‘Kernprognose 2019-2060’ to form a good baseline.
I determine the expected mortality for 2021 with covid as the only disturbing factor in 2020 and without excess mortality from covid in 2021. The expected mortality equals the ‘Kernprognose 2019-2060’ for 2021 minus the estimated adjustment. See table 4.
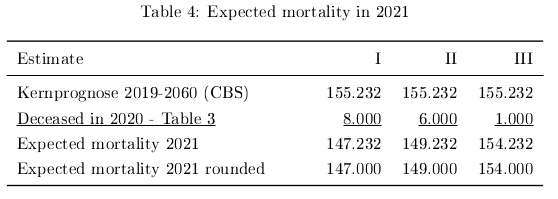
Estimates I and II are realistic. They both give a significant change from the estimate from the ‘Kernprognose 2019-2060’.
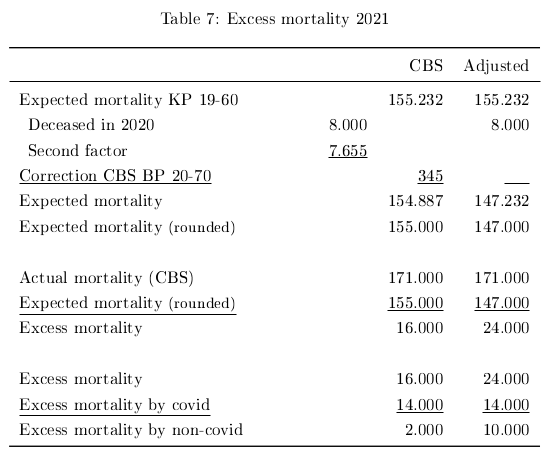
In the ‘Bevolkingsprognose 2020-2070’ in 2020 the CBS adjusted the estimates for 2021 to 154.887 (CBS, 2023a). This is 345 less than the estimate from the Kernprognose 2019-2060 (155.232) and close to estimate III from table 4. Then the question arises why this estimate differs from the first two. According to the CBS the effect from covid from the year 2020 is included in the estimate from the BP 20-70. Hence there must be another major disturbance of 8.000 – 345 = 7.655 besides covid. The CBS doesn’t mention this second disturbance. And if there was another disturbing factor then remember that we want to calculate the expected mortality with covid as the only disturbing factor. A second disturbing factor gives an extra expected mortality that has to be added to the excess mortality.
Another possibility is the following. Life expectancies in year-groups are usually adjusted in the beginning of the year based on the population in the beginning of the year. This is done with a percentage based on previous years. This percentage is a reflection of volume. With the pandemic the weak were hit heavily by covid. A consequence is that the distribution of life expectancy changes in the year groups. This increases the life expectancy in the year group and decreases the expected mortality. Then the percentage for the year groups has to be adjusted accordingly. An example clarifies this.
Suppose there is no covid. We have at 1-1-2021 a group of thousand 81 year old people. Based on numbers from previous years we expect 30% of these to die in 2021. This amounts to 1.000 x 30% = 300 people.
Now there is covid. Assume that in 2020 the covid pandemic is the only disturbing factor. We want to get the expected mortality for the year 2021, without covid or other disturbing factor in 2021, at 1-1-2021. Mortality from covid in 2020 has consequences for expected mortality in 2021 so we use this in our calculations. Suppose 350 people from the former group of 1.000 die in 2020 from covid. Thus remaining 650 people at 1-1-2021. From covid the weak, those with the lowest life expectancy, die first. Suppose that from the expected 300 deaths for 2021 without covid now 200 have died from covid. Thus 100 from remaining group of 650 die in 2021 and 550 in later years. Then the mortality rate is (100 : 650) x 100%= 15.4%. When the expected mortality of this group is determined on the basis of historical data we get an expected mortality of 30% x 650 = 195. This is an overestimation. The historical percentage is a correction for volume. It doesn’t consider the changed composition of the year group. The numbers have to be corrected for that. In this case we have to lower the expected mortality from 195 to 100.
This effect also works when we determine the remaining life expectancy. From this expected mortality is derived. For further reading see my article: ‘Expected mortality adjusted for distribution’ (Lugtigheid, 2023a).
It is up to those who come up with these numbers, in this case the CBS, to explain the difference with estimates I and II and to investigate if the above applies.
Other estimates, like the following, are done in a similar way.
In 2021 19.090 people, rounded to 19 thousand, died from covid (CBS, 2022). I give three estimates of how many people would have died in which year without covid. See table 5.
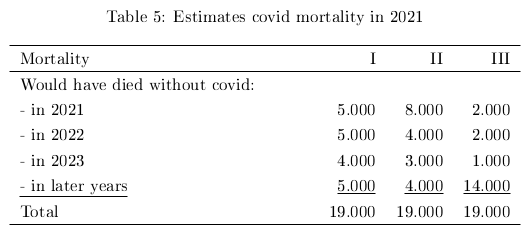
I use estimate I in this article.
So for example I estimate that in 2021 five thousand out of 19 thousand people who died from covid would also have died in 2021 without the pandemic. Etcetera.
Mortality in 2020
In 2019 in the ‘Kernprognose 2019-2060’ the CBS estimated the expected mortality for 2020 at 153.402 (CBS, 2019). In 2020 year 168.678 people died (CBS, n.d.-b). This was 15 thousand more than expected .
In 2020 20.661, rounded 21 thousand, people died from covid (CBS, 2022). I use estimate I from table 3 and estimate that without the pandemic seven thousand of those also would have died in 2020. This is excess mortality in the year. Then the annual year on year excess mortality from covid in 2020 is 14 thousand. With excess mortality of 15 thousand excess mortality from other causes in 2020 is one thousand.
Suppose one thousand people have died from other causes earlier in the year than expected. This could pertain to older people who where not allowed to have visitors and therefore suffered psychological harm and died earlier. The effect is there but we have no numbers about it. I use the lowest possible number, one thousand, to account for this effect. Then the total premature mortality in 2020 becomes 23 thousand (15+7+1). See table 6.

Mortality in 2021
In 2019 in the ‘Kernprognose 2019-2060’ the CBS estimates the mortality for 2021 to be 155.232. (CBS, 2019). In 2020 the CBS adjusted this to 154.887 in de ‘Bevolkingsprognose 2020-2070’ (CBS, 2023a). A difference of 345. The last estimate excludes excess mortality from covid in 2021.
In 2020 21 thousand people died from covid. I estimate that from these eight thousand people (table 3: estimate I) would have died in 2021 without the pandemic. We decrease the expected mortality of 155.232 with eight thousand to 147.232 thousand. We round these numbers.
The expected mortality from the second factor then equals 8.000 – 345 = 7.655.
In 2021 170.972, rounded 171 thousand, people died (CBS, n.d.-b). The CBS calculates with an expected mortality of 155 thousand an excess mortality of 16 thousand. We adjust the expected mortality to 147 thousand. The excess mortality becomes 24 thousand.
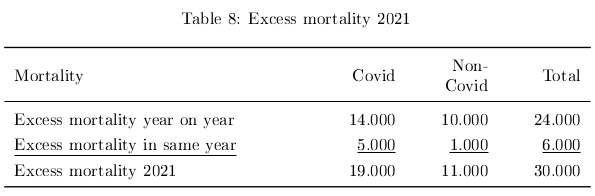
In 2021 19 thousand people died from covid (CBS, 2022). I estimate that from these five thousand people would have died also in 2021 without covid (table 5: estimate I). Then the excess mortality due to covid is 14 thousand. The excess mortality by other causes than covid becomes two thousand (CBS) and ten thousand. See table 7.
In 2021 the adjusted excess mortality on an annual base was 24 thousand. I estimate that five thousand people died early by covid who, without the pandemic, would have died later that year (table 3: estimate I). This is excess mortality in the year. There were also people who died early by other causes than covid but would otherwise have died later that year. This might for example be because of postponed medical treatment. How many is difficult to estimate. For this paper I assume their number to be one thousand. Then the total excess mortality in 2021 equals 30 thousand people (24+5+1). Or, otherwise calculated, 19 thousand people died prematurely from covid and eleven thousand from other causes. See table 8.
The CBS calculates the excess mortality year on year based on the expected mortality each year. This gives a limited view. When we take the above effects into consideration we get a better overall picture of the total mortal damage done by the pandemic.
With the excess mortality of ten thousand from other causes in 2021 I estimate how many people would have died in which year without the pandemic. We need this with the numbers for 2022 and later years. See table 9.

It is not clear which estimate is the best. Not taking this effect in account is bad practice. For this article I us estimate I.
Mortality in 2022
In 2019 the CBS estimated in the ‘Kernprognose 2019-2060’ the mortality for 2022 to be 157.173 (CBS, 2019). At the end of 2021 the CBS adjusted in the ‘Kernprognose 2021-2070’ this to 155.493 (CBS, 2023). A difference of 1.680. The last estimate excludes excess mortality from covid in 2022.
In 2020 21 thousand people died from covid. I estimate that from these two thousand people would have died in 2022 without the pandemic (table 3: estimate I). In 2021 nineteen thousand people died from covid. I estimate that from these five thousand people would have died in 2022 without the pandemic (table 5: estimate I). In 2021 excess mortality from other causes than covid was ten thousand. I estimate that from these two thousand would have died in 2022 without the pandemic (table 9: estimate I). We lower the expected mortality of 157.173 with nine (2+5+2) thousand to 148.173 thousand.
The expected mortality from the second factor then equals 9.000 – 1.680 = 7.320.
In 2022 170.112, rounded 170 thousand, people died (CBS, n.d.-a). The expected mortality becomes 15 thousand (CBS) and 22 thousand.
In 2022 8.2 thousand, rounded 8 thousand, people died from covid (CBS, 2023b). I estimate that two thousand people also would have died in 2022 without covid. Then the excess mortality due to covid is six thousand. With excess mortality of 15 thousand excess mortality by other cause than covid comes to be nine thousand. We adjust the excess mortality from 15 thousand to 22 thousand. The excess mortality by other causes than covid becomes sixteen thousand. See table 10 for an overview for 2022.

In 2022 the adjusted mortality on an annual base was 22 thousand. Also two thousand people died early by covid but would otherwise have died later that year. There were also people who died early by other causes than covid but would otherwise have died later that year. This might for example be because of postponed treatment. How many is difficult to estimate. For this paper I assume their number to be one thousand. Then in 2022 total excess mortality comes to 25 thousand people (22+2+1). Or, otherwise calculated, eight thousand people died prematurely from covid and seventeen thousand from other causes. See table 11.

Mortality in 2023 and later
Calculations like the above can and must be made for 2023 and subsequent years.
Suppose in 2020 two thousand people died who would have died in 2023 without the pandemic, in 2021 five thousand and in 2022 two thousand. Then we have to adjust the expected mortality (baseline) with nine thousand. And so on for subsequent years.
Discussion
The main question in this article is whether the excess mortality is underestimated. The answer seems affirmative for the numbers from the CBS in the Netherlands. For numbers in other countries this could be a reason to evaluate those numbers.
Looking at a global level at the numbers seems to be a good way to get an indication of the correctness of the official numbers. It is important to presume one disturbing factor, in this case covid. The much used method of correcting the expected mortality by a historical based percentage might give a false sense of accuracy: ‘with this correction we have taken everything into account’. But with only one disturbing factor the end-result must be the same.
It seems important to note that covid changes the distribution of the life-expectancy in the year-groups. And consequently this effect plays a role whether the excess mortality is calculated correctly. This is also important with calculations with regard to expected mortality, life expectancy and so on.
The used estimates give an indication of direction and size of the adjustment of the expected mortality. These estimates are new. There is still much uncertainty and is seems that point estimates are not yet feasible. To research whether the excess mortality is underestimated the estimates look good enough. It is recommended to develop techniques to better estimate and measure those quantities.
The numbers also show that the excess mortality due to other causes than covid increases strongly. This might seem unexpected. But mortality from covid was a known quantity. Then it seems logical that more excess mortality is due to non-covid.
Conclusion
Excess mortality seems to be underestimated by the CBS. For other countries similar calculations can be made.
The usual method of calculating expected and excess mortality can possibly give wrong results. It is important when calculating the expected mortality to review whether the method of calculation requires adjustment.
The method in this article gives a good indication for excess mortality year to year and excess mortality within the year. Also it becomes clear how excess mortality breaks up in covid and non-covid causes. Especially the increase in reported number of non-covid excess mortality is reason for concern.
These insights are important when researching the excess mortality and evaluating the pandemic and the policies from governments.
Appendix A
Example of the ‘waterbed effect’ for two years
This example contained an error. I corrected this in December 2025.
I give first the corrected version.
Following that the old version with the error. This shows how changes influence other values and how easy it is to make a mistake.
Below we compare two scenario’s.
Scenario I :
– estimate for 2021 ‘Already deceased in 2020’ : 8.000
– estimate for 2022 ‘Already deceased in 2020’ : 2.000
Scenario I adjusted (yellow):
– decrease estimate scenario I for 2021 ‘Already deceased in 2020’ with 2.000 from 8.000 to 6.000. Then excess mortality in 2021 decreases with 2.000 to 22.000.
– increase estimate scenario I for 2022 ‘Already deceased in 2020’ with 2.000 from 2.000 to 4.000. Then expected mortality in 2022 decreases with 2.000. But because excess mortality in 2021 decreased with 2.000 we must lower the amount of the adjustment for 2022 of ‘Already deceased in 2021’. Say from 5.000 to 4.000 (cyan). Then expected mortality for 2022 decreases with 1.000 (2.000 – 1.000). And so excess mortality increases with 1.000.
Thus the waterbed-effect in adjustment of expected mortality from 2020 does not translate one to one in equal amounts of excess mortality.

Earlier we had the following table with estimates in which year people would have died without covid.
In this table the waterbed-effect is clear. The reason is that the total always adds up to 21.000.
However, when we work with those estimates we have to pay attention to what we do afterwards with these numbers.
And below the old example to show how easy it is to make a mistake (red)
Here we compare two scenarios.
Scenario I :
– estimate for 2021 ‘Already deceased in 2020’ : 8.000
– estimate for 2022 ‘Already deceased in 2020’ : 2.000
Scenario I adjusted :
– decrease estimate scenario I for 2021 ‘Already deceased in 2020’ with 2.000 from 8.000 to 6.000
– increase estimate scenario I for 2022 ‘Already deceased in 2020’ with 2.000 from 2.000 to 4.000

In table 14 we see that excess mortality for the years combined remains the same. So when an estimate in one year is to high, then that is compensated in another year and total mortality for the years combined remains the same. This shows that a change in one year has consequences for other years. This has to be taken into consideration with every changed estimate.
Literature
CBS (n.d.-a). Vragen en antwoorden over de sterftecijfers. https://www.cbs.nl/nl-nl/faq/corona/medisch/vragen-en-antwoorden-over-de-sterftecijfers
CBS (n.d.-b). Sterfte-Overledenen-Toon tabel. https://www.cbs.nl/nl-nl/visualisaties/dashboard-bevolking/bevolkingsgroei/overlijden
CBS (2019, 16 december). Prognose bevolking; kerncijfers, 2019-2060. https://www.cbs.nl/nl-nl/cijfers/detail/84645NED
Centraal Bureau voor de Statistiek. (2022, 23 juni). 3.4.4.1 Overledenen, verwacht, minus COVID-19, oversterfte en COVID-19-sterfte; Totaal, Wlz-zorggebruik, leeftijd, per oversterftegolf en jaar https://www.cbs.nl/nl-nl/longread/rapportages/2022/sterfte-en-oversterfte-in-2020-en-2021/3-beschrijving–over–sterfte-en-doodsoorzaken-in-2020-en-2021
CBS (2023a, april) Oversterfte en verwachte sterfte https://www.cbs.nl/nl-nl/nieuws/2023/04/2022-derde-jaar-op-rij-met-oversterfte/oversterfte-en-verwachte-sterfte
CBS (2023b 25 april ). In 2022 veel minder mensen aan COVID-19 overleden dan in 2020 en 2021.https://www.cbs.nl/nl-nl/nieuws/2023/17/in-2022-veel-minder-mensen-aan-covid-19-overleden-dan-in-2020-en-2021
Lugtigheid, Hans. (2023a, september) Expected mortality adjusted for distribution https://www.hanslugtigheid.nl/expected-mortality-adjusted-for-distribution
Lugtigheid, Hans. (2023b, september) Excess mortality: test https://www.hanslugtigheid.nl/expected-mortality-test
Lugtigheid, Hans. (2023c, september) Scientific model https://www.hanslugtigheid.nl/scientific-model
© 2023. This work is licensed under CC BY 4.0