Hans Lugtigheid
The Koninklijk Actuarieel Genootschap (AG) (Royal Dutch Actuarial Association) presented its latest Projections Life Table AG2024.
Observation 1: Volume
AG uses in this table the parameter η for change in excess mortality. Because the observed decrease of excess mortality is less then expected in AG2022 it is decided to adjust the parameter η upward. For AG2024 this means that η= 0,75. This implies that excess mortality decreases every year with 25%.
Excess mortality according to the CBS (Dutch Bureau for Statistics) in the years 2020-2023 is known. After 2023 we decrease excess mortality every year with aforementioned 25% by AG2024. Total excess mortality for the years 2020-2030 then amounts to 91,7 thousand. See table.
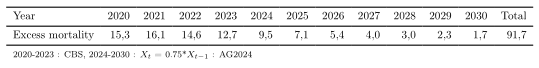
Hence the AG expects that up and to 2030 a total of 91,7 thousand people will have died who would have died in 2031 or later without the pandemic. Now assume that as of 2031 we are back to the same situation as pre-pandemic. Then these 91,7 thousand have to be subtracted from the total expected mortality in the years 2031 and beyond. In which years is yet to be estimated/determined. This is mortality displacement or pull forward effect. For the years 2020-2030 this is also an issue.
Observation 2: Mortality rates
The pandemic has hit heavy on already vulnerable people. Hence it is likely that a significant part of the 91.7 thousand were weaker than their peers at the same age. Hence the relatively stronger ones remained. Then the remaining age-group has a lower average mortality rate than the original group without covid. For the years after 2030 this effect has to be considered in the analysis and calculations of mortality rates.
An example of changed mortality risk in an age-group and the effect on excess mortality.
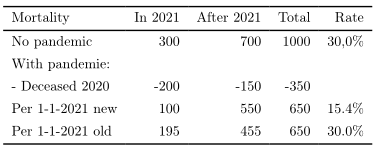
Situation 1: There is no pandemic
Suppose in a village at 1 January 2021 we have one thousand people with age X. Based on previous years we expect 300 people from this group to die in 2021 and 700 after 2021. So the mortality rate is 30%.
Situation 2: There is a pandemic
Suppose 350 out of the original 1.000 died in 2020 from covid. This is excess mortality in 2020. Then at 1 January 2021 there are 650 people remaining of age X. Suppose that without the pandemic from this 350 people who died in 2020 from covid 200, the more vulnerable, would have died in 2021 and 150 in 2022 or later. Suppose the pandemic is over per 1 January 2021. Than in the remaining group the mortality rate for 2021 is 100/650=15.4%. With the old percentage of 30.0% mortality would come at 30.0% * 650 = 195. This is an overestimation of 95. See table.
In AG2024 the reduced expected mortality after 2030 en the changed mortality rates are not (explicitly) discussed. This seems to be a matter of interest for the AG.
See also:
https://www.hanslugtigheid.nl/excess-mortality-start/
https://www.actuarieelgenootschap.nl/english
https://www.actuarieelgenootschap.nl/kennisbank/projections-life-table-ag2024-1
This article is licensed under:
Creative Commons Attribution 4.0 International